Pareto Analysis is a decision-making approach grounded in the Pareto Principle (or the 80/20 rule), which asserts that 80% of effects result from 20% of causes.
This statistical method identifies the most important factors in a problem or situation through ranking problems by frequency, cost, or impact.
This means that to understand the root causes of something, you must identify the 20 per cent of most influential factors that caused a certain outcome. For example, suppose a certain outcome was to change people’s spending habits. In that case, we might find the 20 per cent of the most influential factors that cause people to spend, based on their personality and beliefs, spending behaviour, income, and so on.
Pareto Principle
The Pareto Principle, which is also known as the 80/20 rule, the law for life and sparsity, shows that 20%, or as a lamen, of your actions and activities account for 80% of your results and results, 80% are the consequence of 80% of the impacts. 20% of the waste is caused by 20% of your actions.
Pareto was an Italian economist and sociologist who observed that roughly 20% of the population controlled 80% of the land in Italy. This Pareto principle is alive and thriving in the quality and continuous improvement industry today. It is commonly acknowledged that a small percentage (20%) of causes account for 80% of problems.
The rule proposes a disproportionate connection among inputs and outputs, causes and consequences, or work and outcomes. A few usual illustrations are:
- 80% of deals frequently arise from 20% of customers
- 80% of grievances arise from 20% of customers
- 80% of productivity arises from 20% of employees
- 80% of assets are possessed by 20% of the population
- 80% of software errors originate from 20% of code
The principle is not so much for the precise 80/20 ratio (which will differ) but for showing the non-proportional correspondence between effort and result, which allows organizations to recognize high-leverage activities and resource them better.
Implementation of Pareto Analysis
Step 1 Problem Identification and List
Write a list of all the issues you need to fix. Collect feedback from customers and team members as far as feasible. This could take the shape of, for example, consumer surveys, official complaints or helpdesk records.
Step 2 Identify each problem’s root cause
Next, come to every problem’s fundamental cause. Tools for this are techniques like the 5 Whis, Cause and Effect analytics and Root Cause Analysis.
Step 3 Issues of Score
Now, you can identify every concern you have listed. The scoring you choose will depend on the type of problem you want to solve.
You may, for instance, find faults with how much it costs if you want to boost earnings. Or you might rate them depending on the number of complaints you received about each one if you are aiming to increase customer satisfaction.
Step 4 Together Group Problems
Use the root cause analysis done in step 3 to categorize issues by common cause. You may, for instance, include these in the same group if there are three difficulties caused by a shortage of workers.
Step 5 Add up Each Group Scores
Now, add the scores for every category you have identified. Your highest priority should be the one with the top score and your lowest priority the group with the smallest score.
Step 6 Action to Take
It’s time for action, finally! You will probably have the largest payout after your highest scoring problem is resolved; hence, start thinking of ideas about the first way.
You may find it interesting to note your lowest score problems, especially if they are exceedingly expensive to cure. To conserve your efforts and resources, use your Pareto Analysis.
Also Read: What Are The Steps of Conjoint Analysis?
What does a Pareto Chart tell you?
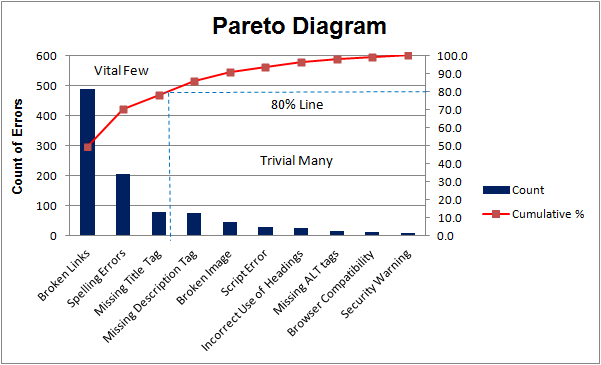
A Pareto Chart is a fundamental quality tool that may help you find the most common problems, complaints or any other aspect. The graphic draws its name from the creator of the ’80/20 rule,’ Vilfredo Pareto, who suggests that 20% of individuals have 80% of the wealth. In terms of quality, 80% of the losses are caused by 20% of the reasons.

The most common Pareto chart you will see online is a “bar chart”. There are two main ways that Pareto charts have been used. The first is to present the frequency of the factors and the second is to present a ratio. A Pareto chart is usually composed of bars (or rectangles). The vertical axis usually shows frequency, but it may be an impact ratio instead
Advantages of Using Pareto Analysis
Pareto analysis has multiple benefits and advantages. Pareto analysis helps one gain a deeper understanding of the data, and the results help in decision-making and provide information about the data that we can use to predict or make assumptions about the outcome of the analysis.
Some advantages of Pareto analysis are as follows:
- It’s easy to draw a Pareto chart.
- It allows you to separate issues and causes.
- It allows you to solve the few difficulties that create the greatest problems.
- It shows you the problems to focus on improving the most.
- It allows you to envision difficulties and is a great tool for visual communication.
Also Learn: What is Simonson and Rosen’s Influence Mix?
Drawbacks of Pareto Analysis
Oversimplification of Complicated Issues
Pareto Analysis is effective in most environments, but it tends to trivialize subtle situations by breaking down complex problems into simply quantifiable variables. The reductionist strategy can lose the refined interdependencies between causes and outcomes, ignoring factors that don’t neatly fit into numerical valuations. In complicated organizational or social processes, issues usually arise from dense webs of causality, not from several distinct causes that can be separated conveniently and ranked accordingly.
Neglect of Long-Term Impact Factors
Another major shortcoming exists in the likelihood of missing what can be referred to as “slow-burning” causes. Pareto Analysis is apt to focus on problems with direct, overt effects while perhaps underestimating forces that might have important long-term effects but don’t yet show up as significant contributors. Temporal bias may compel organizations to tackle symptoms rather than deeper system problems, with subsequent short-term gains at the cost of long-term solutions.
Vulnerability to Confirmation Bias
The Pareto Analysis methodology is prone to confirmation bias at the data-gathering and classification stages. Analysts might unwittingly gather or classify information in manners that confirm their preconceived notions about the key causes. This natural human propensity can highly bias results, particularly when classification categories are determined subjectively. Without strict procedures in place to guarantee objectivity, the analysis can merely confirm current suppositions instead of uncovering actual patterns of causality.
You May Like: Why diversity is good for teams and organisations
Conclusion
The Pareto principle provides insight into the widest variety of phenomena, discriminating between those that are important and those that are not, identifying the most significant problems and their root causes, and so defining the direction of remedial activities (Mateides, 2006). This makes it a rational and meaningful instrument for making decisions. Other aspects are ‘insignificant’ and are typically not required to be addressed within a specific phase of problem resolution.